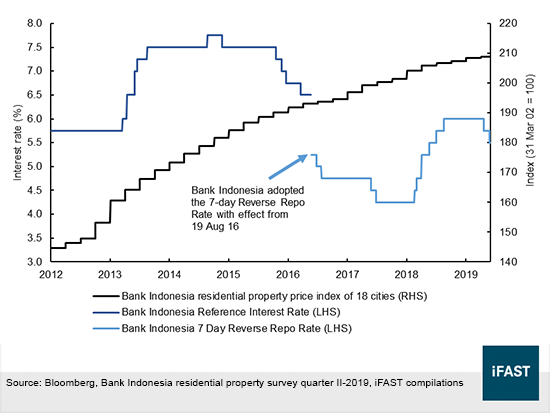
Indonesian property prices have been steadily rising in spite of fluctuating interest rates, and amid strong economic growth. The aggregate residential property price index of 18 major Indonesian cities recorded an annual average growth rate of 5% in the last seven years, while Indonesia’s GDP expanded between 5% and 6% since 2012 (see Figure 1). Concurrently, benchmark interest rate were kept in a range between 4% and 8%, and property prices continued climbing even as Bank Indonesia tightened monetary policy between 2013 and 2015 to contain inflation.
The high residential property prices were driven by favorable policy moves. In November 2015, Indonesia’s government removed double taxation on real estate investment trusts (“REIT”) to attract more REIT listings into the country. In the following year, individual foreigners who work or live in the country were allowed to own residential property.
In 2018, Bank Indonesia reduced interest rates and increased the loan-to-value ratio to improve credit growth. In addition, the government lifted the luxury tax threshold limit in June 2019, making it more affordable to purchase expensive houses.
The tax revisions, lower interest rates and higher property valuations are a boon to PT Ciputra Development Tbk (“CTRA”) — a real estate developer with an IDR20 trillion market capitalization listed on the Indonesia Stock Exchange. CTRA is one of Indonesia’s largest developers with a diversified product offering, sizeable land bank and established track record. The company’s only outstanding SGD bond — the CTRAIJ 4.850% 20Sep2021 Corp (SGD) — has a yield to maturity of 4.85% at the indicative ask price of 100.
Figure 1: Indonesia’s residential property price index and benchmark interest rates
About CTRA
Since the establishment of the Ciputra Group (now the holding company of CTRA) as a family business in 1981, the group has accumulated more than 30 years of project development experience. As of 2Q19, it manages more than 75 projects in 33 cities across Indonesia.
CTRA filed its initial public offering on the Jakarta Stock Exchange in 1994. A property boom in 1995 lifted total revenue to IDR514 billion. By 1996, total revenue continued growing to IDR565 billion. However, sales then declined to IDR381 billion and the property developer booked net losses with the onset of the 1997 Asian Financial Crisis.
Pressured by large amounts of foreign currency debt on its balance sheet and the depreciation of the IDR against the USD, the company was unable to service its debts. Management restructured the debt and it was not until 2002 before sales climbed back above IDR447 billion, returning almost to its pre-crisis levels.
2016 was a momentous year for the firm as CTRA initiated a merger with two of its listed subsidiaries to create one of the largest property firms in Indonesia. PT Ciputra Surya Tbk (“CTRS”), a property management subsidiary in the Jakarta metropolitan area, and PT Ciputra Property Tbk (“CTRP”), a real estate firm in the Surabaya and East Java region, combined with CTRA as the group sought to improve its financial strength and access to capital.
Back then, the
company wanted to raise trading liquidity and conducting a merger would have
made sense, as it would likely include CTRA in a major equity index such as the
MSCI Indonesia. Second, the transaction would also simplify the corporate
structure and improve cost savings by streamlining business functions across
various departments. Soon after the merger was completed, the group’s consolidated
revenue improved from IDR6.4 trillion in 2017 to IDR7.7 trillion in 2018.
CTRA’s bottom line also grew 28% from IDR1.0 trillion to IDR1.3 trillion.
Core activities and top-line performance
The company engages in two main principal activities — residential project development and the management of commercial property. Products of CTRA’s residential project development segment include land plots, residential houses, shop houses, apartments and strata title offices. Commercial property management on the other hand, includes the rental of commercial centers, hotels, offices, hospitals and water parks.
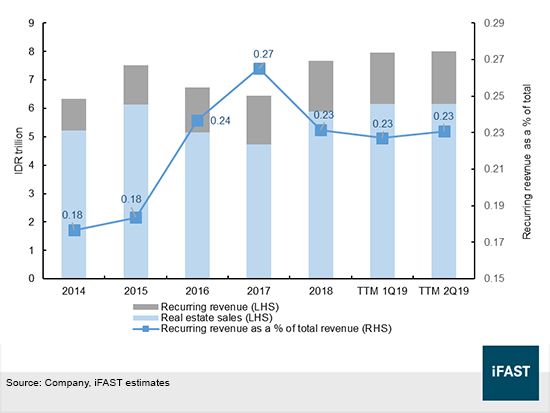
Top-line results have been on an upward trend as the firm registered revenue gains in 2018 and in the trailing twelve months (“TTM”) to June 2019. CTRA recognized revenue on its income statement through the sale of properties (represented as the light blue bars in Figure 2) and recurring income from real estate assets such as rentals from commercial properties (grey bars). Property sales are inherently more volatile and subjected to macroeconomic swings, but rental income from the commercial property management division is regarded as stable, recurring revenue. The proportion of recurring income has generally increased from 2014 to TTM 2Q19 and remained at 23% in the past three TTM quarterly periods.
When accounting for
assets, the firm books transfers of the cost of buildings under construction to
houses, shop houses and apartments available for sale when the construction is
completed. Residential properties are classified as inventories at the time of development
and construction. On the contrary, commercial properties would remain upon
completion as part of inventories or reclassified to fixed assets or investment
property, whichever is appropriate.
Figure 2: Recurring revenue vs property sales
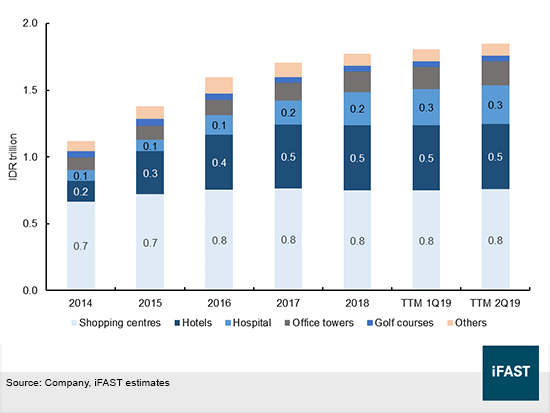
In Figure 3, a
segmental breakdown of recurring revenue showed that shopping centers, hotels
and hospitals accounted for the majority of recurring sales. The group’s
shopping malls registered healthy occupancy rates of 95% to 100% as of 2Q19.
For instance. Ciputra World Jakarta 1, a popular 81,000-square-meter (“sqm”) mall has seen occupancy rates of 100% since 2015. Occupancies at Ciputra Mall Jakarta also increased from 95% in 2016 to 98% in 2Q19. Additionally, CTRA plans to add three more shopping centers to its portfolio of four malls. On a combined basis, these three shopping centers will expand the total net leasable area to ~289,000 sqm by 2022 from its current level of 199,890 sqm.
Hotel recurring revenues have remained constant at IDR0.5 trillion over the recent three quarters although revenue per available room (“RevPAR”) vary across different hotels. RevPAR at Ciputra Hotel Semarang and CitraDream Hotel Cirebon climbed 35% YoY and 18% YoY respectively in 2Q19, while the same measure for CitraDream Hotel Bandung fell 17% from a year ago.
Figure 3: Recurring revenue by segment
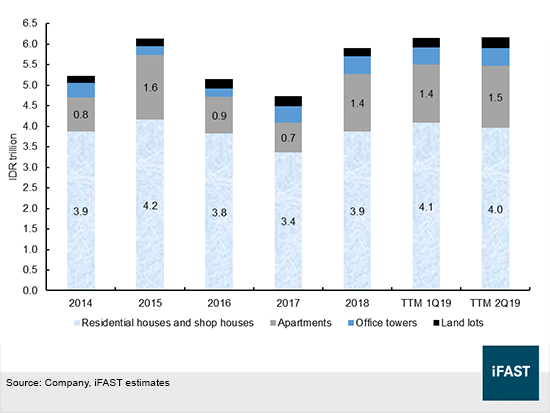
Separately, revenue from residential estate, shop houses and apartments, which account for the bulk of development sales, have improved after reaching a low in 2017 (see Figure 4). The downturn was partly driven by a slowdown in the property market, weak demand and tightening of the luxury tax on houses, resulting in a drop in sales during 2016 and 2017. Sales however turned around in TTM 2Q19 as residential houses & shop houses and apartment sales grew to IDR4.0 trillion and IDR1.5 trillion respectively on the back of government incentives, easier home ownership rules and improved sentiment over the property market.
Figure 4: Property sales by asset type
Housing price trends in the Greater Jakarta (“GJ”) and Greater Surabaya (“GS”) regions are likely to affect CTRA’s credit profile, as a large section of the developer’s land bank resides in the GJ (51%) and GS (41%) areas (see Figure 5). Nearly 2,334 hectares of land are available for development, sufficient to last for another 15 years of real estate construction. CitraRaya Tangerang alone, a project located 40 kilometers from Jakarta, has 770 hectares of land available for integrated township development.
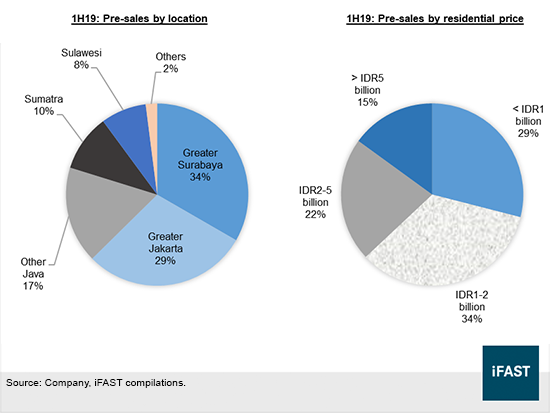
In the first six months of this year, presales in GS and GJ accounted for 34% and 29% of the company’s overall pre-sales respectively. Presales disclosures also reveal that CTRA is mainly focused on the lower-priced tiers of the market as more than half of its presales arrive from units with selling prices below IDR2 billion.
Land lot sales have the biggest profit margins. We suspect this is because the land was acquired at low prices in years earlier and the firm booked large profits from sales as land prices have appreciated significantly. These land sale amounts, however, are insignificant in proportion to total revenue.
Rental incomes from shopping centers on the other hand, are a larger source of total revenue. More notably, operating margins from shopping center revenue have stayed above 60% since 2014. This likely explains the group’s intention to add three more shopping malls to its existing portfolio.
Figure 5: Details of residential presales
Competitor analysis
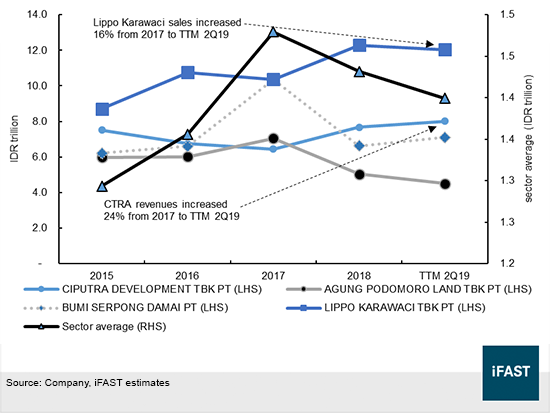
Indonesia’s publicly listed real estate sector is led by the three largest developers by assets — PT Bumi Serpong Damai Tbk (“Bumi Serpong”), PT Lippo Karawaci Tbk (“Lippo Karawaci”) and CTRA. According to Bloomberg estimates, revenues at Lippo Karawaci and CTRA expanded by 16% and 24% between 2017 and TTM 2Q19 respectively (see Figure 6). In terms of revenue growth, CTRA topped the competition with a 24% sales gain between 2017 and TTM 2Q19.
Lippo Karawaci increased revenue by 16% since 2017, and presales increased 84% in 1H19 from a year ago, while recurring revenue grew by 15% YoY. On the other hand, Bumi Serpong, Indonesia’s second largest property developer by assets, witnessed a 31% drop in sales between 2017 and TTM 2Q19 due to “weak property demand and high interest rates on housing loans”. In addition, the firm’s 31% drop in revenue exceeded our estimate of the sector average (based on the sample of publicly listed Indonesian real estate developers) of a 5% decline over the period.
Figure 6: Peer comparison of revenue
Credit highlights
Large developers with high growth rates and a considerable asset base like CTRA tend to have better access to experienced contractors and credit support from lenders. These developers also have higher purchasing power, in addition to having a higher chance of being selected for government land auctions with their long track record in property management.
In TTM 2Q19, CTRA’s earnings before interest and taxes (“EBIT”) were 2.8 times its interest expense, which was higher than Bumi Serpong (2.6x) and Lippo Karawaci (0.4x). EBIT or operating income registered gains even though quarterly finance costs also increased 26% from IDR172m in 2Q18 to IDR217m in 2Q19 on the back of higher foreign currency liabilities, which grew from IDR1.7 trillion to IDR2.0 trillion over the same period. Foreign currency debt accounted for 23% of total debt in 2Q19 with a majority in Singapore-dollar denominated debt. This means that interest expenses are susceptible to fluctuations in the IDR/SGD pair.
In addition to the high revenue growth rate, CTRA’s revenue-to-debt ratio of 91% exceeded peers in TTM 2Q19. The ratio nearly matched Lippo Karawaci’s 89%, and was significantly larger than Bumi Serpong’s 44%.
While the above indicates that CTRA is more efficient in utilizing debt capital to generate revenues, or apply less leverage relative to its income, we also observe that its entire long-term loan portfolio is secured by real estate. There were a few short-term loans that were not collateralized. More specifically, we found that only (i) the IDR49 billion loan from PT Bank Tabungan Negara (Persero) Tbk used to finance working capital and the development of infrastructure; and (ii) the loan of IDR7.5 billion from revolving credit facilities from PT Bank OCBC NISP Tbk, were unsecured loans in the balance sheet.
With regard to our gearing comparison, we evaluated the firms according to their proportion of debt to total capital. The ratio of debt to total capital might arguably be a better measure than debt over total assets in this instance, as real estate projects often involve sizable amounts of current liabilities due to working capital and deferred taxes. Total capital excludes these sources of funding such as payables owed to contractors or the government (taxes), and focuses instead on the invested capital from debtholders and shareholders.
On this note, the debt-to-total capital measure for CTRA reached 34% in 2Q19, which was slightly higher than Lippo Karawaci (31%) and Bumi Serpong (29%). The results showed that CTRA had the highest gearing among Indonesia’s three largest publicly listed property developers, although the difference was marginal in our perspective. We are initiating research coverage on CTRA with a positive credit outlook, which reflects our view that the issuer's credit ratios will remain steady over the next 12 months, given the good quality and location of its assets in the Greater Surabaya and Greater Jakarta regions. The positive outlook also factors in our expectation that CTRA will maintain or increase its EBIT-to-interest multiple of 2.8x, and retain a revenue-to-debt ratio of at least 91%.
With the above factors in mind, we prefer CTRA’s credit profile over Lippo Karawaci and Bumi Serpong for its healthy revenue growth and higher interest coverage ratio. While CTRA had a higher debt-to-total capital ratio, its revenue-to-debt percentage suggested that the firm was generating more sales relative to its borrowings over its peers.
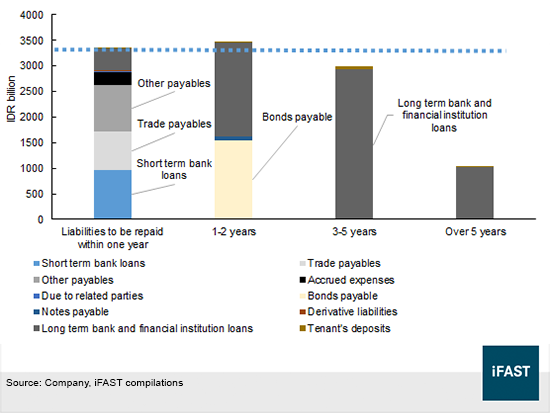
In consideration of its liquidity risk profile (see Figure 7), the company has to meet IDR3.4 trillion of liabilities within the next year (from 30 Jun 19). We think the firm’s cash position of IDR3.4 trillion is sufficient to cover its short-term liabilities, which includes IDR745 billion of trade payables and IDR912 billion of other payables. The short-term payables could likely be offset by current assets and that leaves us with current bank and financial institution loans of IDR1.4 trillion.
Looking beyond the one-year time frame, we observe that long-term financial loans and bonds form the bulk of total liabilities. At this juncture, we estimate that CTRA could carry over at least IDR1.4 trillion of cash beyond 2Q20, but that may not meet its IDR3.5 trillion of liabilities due in 1-2 years. Nonetheless, the firm is likely to make up for the shortfall through additional capital raising.
Free cash flows (“FCF”) were approximately negative IDR1.4 trillion in 2017 and negative IDR175 billion in 2018. FCF remained negative in TTM 1Q19, but surged to ~IDR74 billion in TTM 2Q19. This was a result of an improvement in operating cash flow in 4Q18 and 1Q19, in line with higher net profit of IDR646 billion and IDR298 billion respectively. The jump in FCF in TTM 2Q19 represents a reversal of IDR227 billion from TTM 1Q19 (negative IDR153 billion), but FCF would still likely fall short of the IDR3.5 trillion of payables (due between 2Q20 and 2Q21) at the present rate of cash flow generation.
We may lower our credit outlook if CTRA's financial leverage increases, such that its ratio of revenue to debt drops below 80% on a sustained basis. This is a possibility if demand declines and CTRA is unable to sell its properties in a reasonable timeframe. After all, CTRA did not achieve their sales target of IDR7.7 trillion in 2018 due to low presales of new units and delays in the launch of of two residential projects. We may also downgrade our outlook if Indonesia’s economic climate deteriorates and poor real estate sentiment weigh on its credit profile, resulting in an interest coverage multiple below 1.5x.
Figure 7: CTRA’s financial liabilities based on timing of repayment (as of 2Q19)
The CTRAIJ 4.85% 2021 SGD note
The CTRAIJ 4.850% 20Sep2021 Corp (SGD) was issued under CTRA’s September 2017 S$200m multicurrency medium term note program (the “MTN Program”). The issue size is S$150m and retains a rank of senior unsecured within the capital structure. The issuer has to comply with terms mentioned in the MTN Program, including a negative pledge clause and financial covenants including (1) keeping a consolidated tangible net worth of more than IDR8 trillion; (2) ensuring that consolidated total debt over total equity does not exceed 1x; and (3) keeping a consolidated secured debt-to-total asset ratio of less than 0.5 to 1.
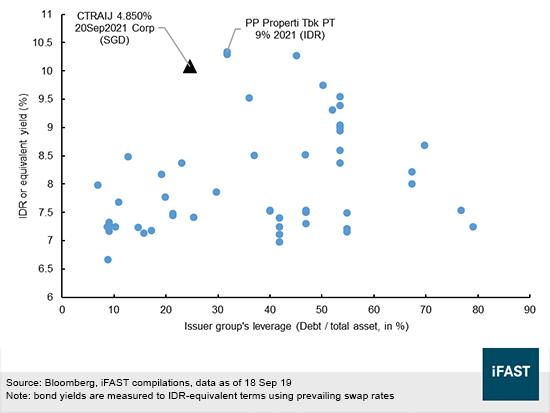
One factor in favor of the CTRAIJ 4.850% 20Sep2021 Corp (SGD) is its relative valuation in comparison to other senior unsecured Indonesian issues. We think that the bond’s ask yield to maturity (“YTM”) of 4.85% (IDR equivalent: 10.1%) on 18 Sep is attractive (see Figure 8). In relation to Figure 8, bonds with a higher yield and lower issuer leverage are generally preferred, so with this in mind, we would be inclined to recommend issues to the top left of the diagram. As can be seen from the chart, PP Properti’s 9% IDR notes due 2021 stand out for their high yield, but we do not find it as attractively priced as the issuer is more levered and has a lower revenue-to-debt ratio of 36% (vs CTRA’s 91%).
Figure 8: Relative valuation (bonds maturing in 2H21)
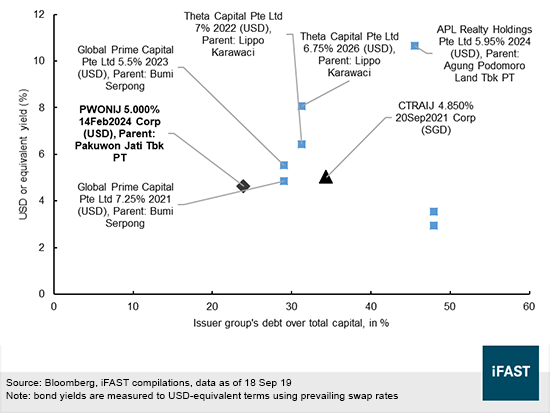
We compared the CTRAIJ 4.85% ’21s to other Indonesian property developer credits and found a more attractively priced bond. Referring to Figure 9, we think bondholders looking at USD exposure can consider investing in the PWONIJ 5.000% 14Feb2024 Corp (USD) for its lower gearing and YTM that is not too far behind the CTRAIJ 4.85% ’21s. The parent company of the issuer (Pakuwon Prima Pte Ltd), PT Pakuwon Jati Tbk (“Pakuwon”), is the fifth largest developer in Indonesia with total assets of IDR26 trillion (vs CTRA’s IDR35 trillion) and a 37-year track record. Pakuwon’s revenue-to-debt ratio of 139% also surpasses CTRA, and the developer has a lower debt-to-total capital ratio of 24% as well as a larger percentage of recurring revenue.
For the reasons mentioned earlier in our credit discussion, we would not
be recommending the bonds of Theta Capital Pte Ltd and Global Prime Capital,
which are the financing vehicles of Lippo Karawaci and Bumi Serpong respectively.
APL Realty’s 5.95% notes due 2024 are also not attractive as we think that the
higher yields reflect Agung Podomoro Land’s (the guarantor) high debt level.
Fitch Ratings recently pointed out Agung Podomoro Land’s increasing refinancing
and liquidity risks and downgraded the company’s credit rating to CCC-.
Figure 9: Relative valuation (bonds issued by large Indonesian developers)
Conclusion
A number of positive factors has led us to believe that bond investors would benefit from having some exposure to CTRA’s bonds. The macro environment is favorably set as interest rates could drop and interest rate-sensitive plays such as property developers, could continue to outperform.
CTRA has braved through the Asian Financial Crisis to create a longstanding track record in the industry. The company is also one of Indonesia’s largest and most diversified property developers with multiple income streams from various segments of the property market. Barring any unforeseen developments, we have a positive credit outlook on CTRA over the next 12 months given its present liquidity profile and sizable land bank.
Declaration:
For specific disclosure, at the time of publication of this report, IFPL (via its connected and associated entities) and the analyst who produced this report hold a NIL position in the abovementioned securities.